If you’ve been immersed in the world of cryptocurrency or short-term trading, chances are you’ve heard about the “Bart pattern.” This quirky price chart phenomenon, named after Bart Simpson from The Simpsons, has become a familiar sight on traders’ screens. While it might seem like a humorous nod to pop culture at first, the Bart pattern is a serious indicator of market activity, and understanding it can provide traders with significant insights.
This article dives into what the Bart pattern is, how it forms, and how day traders, stock investors, and technical analysts can use it to inform their strategies.
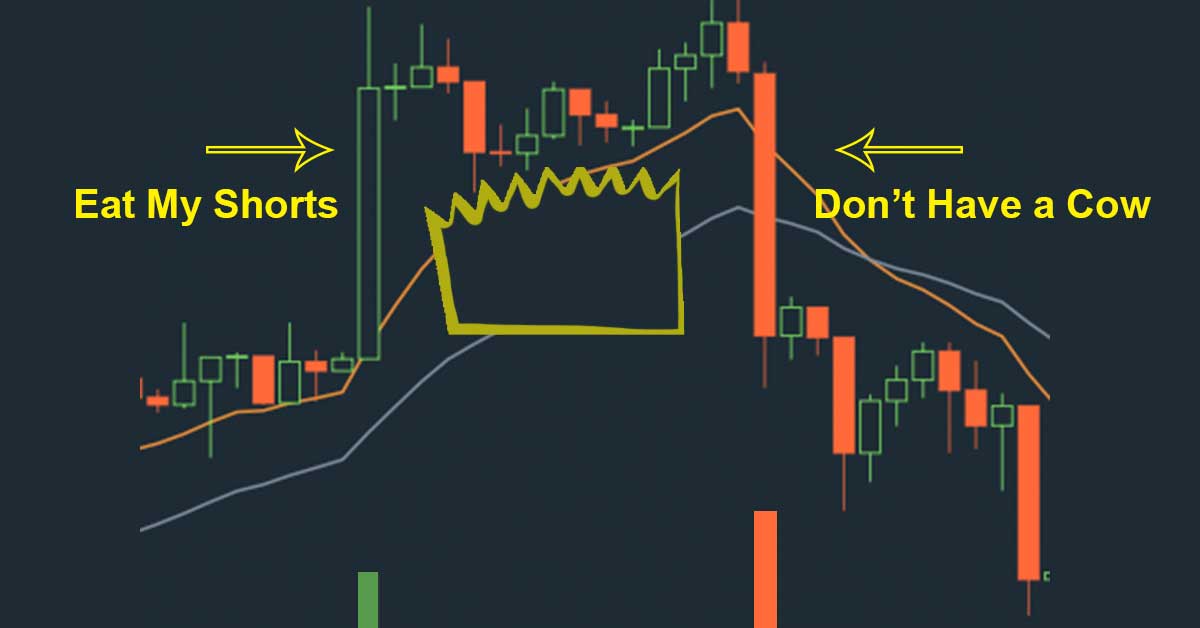
What Is the Bart Pattern?
The Bart pattern is a visual price movement on a trading chart that resembles the spiky hairstyle of Bart Simpson. This pattern typically emerges in cryptocurrency markets and is characterized by three distinct phases:
- A sudden sharp upward or downward spike in price (the “rise” or “fall”).
- A period of sideways consolidation, where prices stagnate around a consistent level (resembling the peaks and valleys of Bart’s spiky hair).
- An equally sharp price movement in the opposite direction (the “return”).
Bart patterns can manifest in two types:
- Upright Bart (Bearish Pattern): Indicates a sharp rise, flat consolidation, and a sudden backslide, signaling bearish movements.
- Upside-down Bart (Bullish Pattern): Shows a sharp drop, consolidation, and a sharp recovery, signaling bullish trends.
While the Bart pattern may seem cartoonish, its implications are anything but trivial.
What Causes the Bart Pattern?
The Bart pattern is often seen in highly volatile and low-liquidity markets, which makes cryptocurrency particularly prone to this phenomenon. Several factors contribute to its occurrence:
- Low Liquidity: Fewer market participants mean any sudden influx of buy or sell orders (sometimes called “whale movements”) can significantly shift prices.
- Market Manipulation: Price manipulation by large players can create artificial spikes or drops, contributing to the pattern.
- Algorithmic Trading: Automated trading algorithms that trigger buy/sell orders based on specific thresholds contribute to these quick, exaggerated movements.
- Lack of Fundamental Drivers: Bart patterns are often driven by technical factors and market sentiment rather than fundamental economic or technological changes.
Why the Bart Pattern Matters for Day Traders and Analysts
While patterns like Bart’s don’t always provide guarantees, they are vital indicators for day traders and technical analysts looking to interpret market behavior. Here’s why they matter:
- Quick moves mean opportunity: Day traders targeting fast profits within short time frames can take advantage of the predictable return legs of these patterns.
- Direction shifts: These patterns often signal sentiment changes in the market and can serve as a warning to prepare for reversals.
- Risk management: Recognizing a Bart pattern forming can prevent traders from entering positions at the wrong time, saving them from potential losses.
How to Recognize and Respond to a Bart Pattern
1. Study Short Time Frames
Bart patterns are most visible on shorter time frames like 5-minute or 15-minute charts. Traders looking too broadly may miss the sharp movements and consolidation periods.
2. Look for Sharp Spikes
If you see a sudden vertical movement in price, pay attention to whether the market starts forming a flat, stagnant range. This is often the beginning of a Bart.
3. Watch for Key Levels
The flat zone, which resembles Bart’s “hair,” often stays within a narrow range. Monitoring these levels can clue traders into potential breakout (or breakdown) points.
4. Use Stop Losses
If you’re trading during a potential Bart pattern, setting tight stop losses can protect your position against sudden, unpredictable reversals.
5. Leverage Volume Analysis
Abnormal volume spikes often accompany Bart formations. Changes in volume during consolidation, or at the start of a reversal, can signal the final phase of the pattern.
6. Stay Skeptical
The Bart pattern is not a guarantee of future movements. Patterns can fail, or external events can disrupt the expected structure. Traders should combine Bart analysis with other technical tools like moving averages or RSI indicators for confirmation.
Real-Life Example of the Bart Pattern
The Bart pattern was particularly prevalent during Bitcoin’s 2018 bear market, appearing frequently in periods of stagnant trading. It’s also a recurring theme in 2023, with recent studies noting its formation as Bitcoin traded between $29,000 and $32,000.
For instance:
- June 2023 BTC Movement: After a significant 20% spike, Bitcoin consolidated sideways at approximately $30,000. Following this, it rapidly declined back down to $25,000, marking an upright Bart pattern. Traders who recognized the risk were able to manage their short positions effectively.
Bart Pattern’s Limitations
While traders can capitalize on the Bart pattern, it’s important to approach it with caution:
- Not in traditional markets: Bart patterns are rarely seen outside crypto or highly volatile stocks because higher liquidity typically dampens such sharp, erratic movements.
- Imperfect indicator: Like all technical patterns, Bart isn’t foolproof. Patterns can be influenced by unrelated factors or fail to complete as expected.
- Market manipulation risks: Since Barts can be triggered by manipulators or large traders, relying solely on this pattern without other supporting data can lead to risky decisions.
The Takeaway
The Bart pattern is a fascinating phenomenon in trading, most prominently seen in cryptocurrency markets. While it may start out party-animated with its cartoonish resemblance to The Simpsons, it’s a deeply telling indicator for short-term price action.
For day traders, technical analysts, or investors, mastering patterns like the Bart is just one of many tools in the trading arsenal. It’s essential to combine this knowledge with sound risk management and an understanding of market fundamentals.
The next time you spot those iconic spikes forming on a chart, remember this guide. Whether the upright Bart signals a bearish turn, or the inverted Bart brings opportunities for bullish plays, you’ll be better equipped to jump in smartly—or perhaps sit out wisely.