For beginner investors and anyone new to the stock market, understanding the jargon and key metrics can be a daunting task. One term that often comes up in the realm of stock market analysis is RS, which stands for Relative Strength. But what exactly is RS, and how can it help guide your investment strategy? Let’s break it down.
What Is RS Stock Meaning?
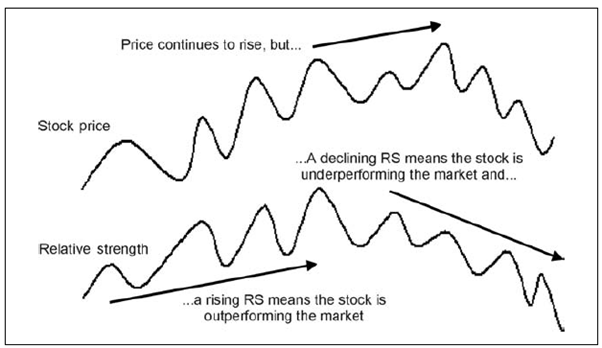
RS stands for Relative Strength, a metric used in stock analysis to measure a stock’s performance compared to others in the market or a specific benchmark index. It helps investors identify which stocks or securities are outperforming or underperforming compared to their peers or the broader market.
Key Takeaway: RS stock meaning focuses on comparing the performance of a stock to either an index like the S&P 500 or against other stocks within the same sector.
For example, if you are analyzing technology stocks, an RS analysis might show how a specific stock performed relative to the Nasdaq Composite Index or peer stocks like Microsoft or Apple.
Why Is Relative Strength Important in Investing?
Relative Strength is an essential concept for both momentum investors and technical analysts. Here’s why it holds value:
- Identifying Market Leaders: RS helps pinpoint stocks that are outperforming the market, enabling investors to focus on top-performing assets.
- Tracking Momentum: Momentum investors use RS to ride the wave of strong trends, assuming that high-performing stocks will continue their upward movement.
- Benchmark Comparisons: By comparing stocks to benchmarks, RS sharpens insights into individual stock performance.
It’s worth noting that RS-based strategies assume that trends generally persist. However, investors must remain cautious, as market disruptions or reversals can quickly make high-performing stocks lose their edge.
Relative Strength Index (RSI) vs. Relative Strength (RS): What’s the Difference?
Though the two terms sound similar, they serve distinct purposes in investing.
- Relative Strength (RS) looks at how one stock performs relative to others over a specific time period. It’s more about comparing the larger picture of stock or sector performance.
- Relative Strength Index (RSI) is an indicator used in technical trading to analyze the momentum of price movements. It identifies whether a stock is overbought (too high) or oversold (too low), using a scale of 0 to 100. Generally, a reading above 70 suggests a stock might be overbought, while a reading under 30 indicates it may be oversold.
For beginner investors, it’s essential not to confuse the two terms!
Real-World Application of Relative Strength
To better grasp the importance of RS, consider this example:
Imagine you are tracking a list of large-cap stocks in the technology sector. Over the past 6 months, the Nasdaq Composite Index has risen by 10%. However, one particular stock, “TechNext Inc.,” has increased by 20% in the same timeframe. This indicates a strong RS score for TechNext, making it a potential candidate for momentum-driven investments.
Similarly, RS can also work in reverse. If a stock consistently underperforms relative to its market or sector, it might indicate potential red flags for investors.
Benefits of Using Relative Strength in Stock Analysis
- Better Decision-Making
RS helps beginner investors make smarter choices by zeroing in on stocks that outshine others in the market.
- Time-Saving Analysis
Instead of analyzing hundreds of stocks, you can quickly eliminate underperformers and focus solely on high-potential options.
- Improved Risk Management
With RS, you aren’t just relying on gut feelings. Instead, you base decisions on concrete data trends, reducing the risk of emotional investing.
- Flexible Application
RS analysis isn’t just for individual stocks. You can apply it to entire market sectors, ETFs, or even asset classes like bonds and real estate.
Limitations of RS Investing
While RS analysis is widely used, it’s not immune to risk. Here are some limitations to be aware of:
- Trend Reversals
RS assumes trends will continue. However, sudden market disruptions, like an economic crisis, can lead to sharp reversals.
- Over-reliance on Outperformance
A high RS score today doesn’t guarantee long-term success; staying informed about other market conditions is crucial.
- Suitable for Stable Markets
Relative Strength works best in relatively stable markets. Extremely volatile periods can disrupt its effectiveness.
How Beginners Can Use RS Effectively
For new investors, using RS to guide your stock choices doesn’t have to be complicated. Here are some steps to get started:
- Choose a Benchmark
Pick a benchmark such as the S&P 500, Dow Jones Industrial Average, or a sector-specific index to compare stock performance.
- Identify Strong Performers
Use stocks that consistently outperform their benchmarks as candidates for further research.
- Combine RS With Other Metrics
RS is best used with other tools like fundamental analysis, Moving Averages, or RSI to ensure a holistic investment approach.
- Use Reliable Tools
Many investment platforms provide built-in RS analysis. Alternatively, financial websites and tools like StockCharts or Finviz allow you to perform relative strength comparisons easily.
Final Thoughts
For beginner investors, understanding RS stock meaning is an invaluable step in developing a solid foundation for stock market investing. By pinpointing top-performing stocks, RS empowers you to make more informed and confident investment decisions.
Keep in mind that while RS is an effective metric, it’s not an all-encompassing solution. Consider combining it with other analysis techniques to optimize your strategy.
Looking for more beginner-friendly guides? Explore our platform for tips and strategies to elevate your investment game!